1Max Planck Institute for Informatics, Saarland Informatics Campus2CISPA Helmholtz Center for Information Security3University of Freiburg
★Equal contribution
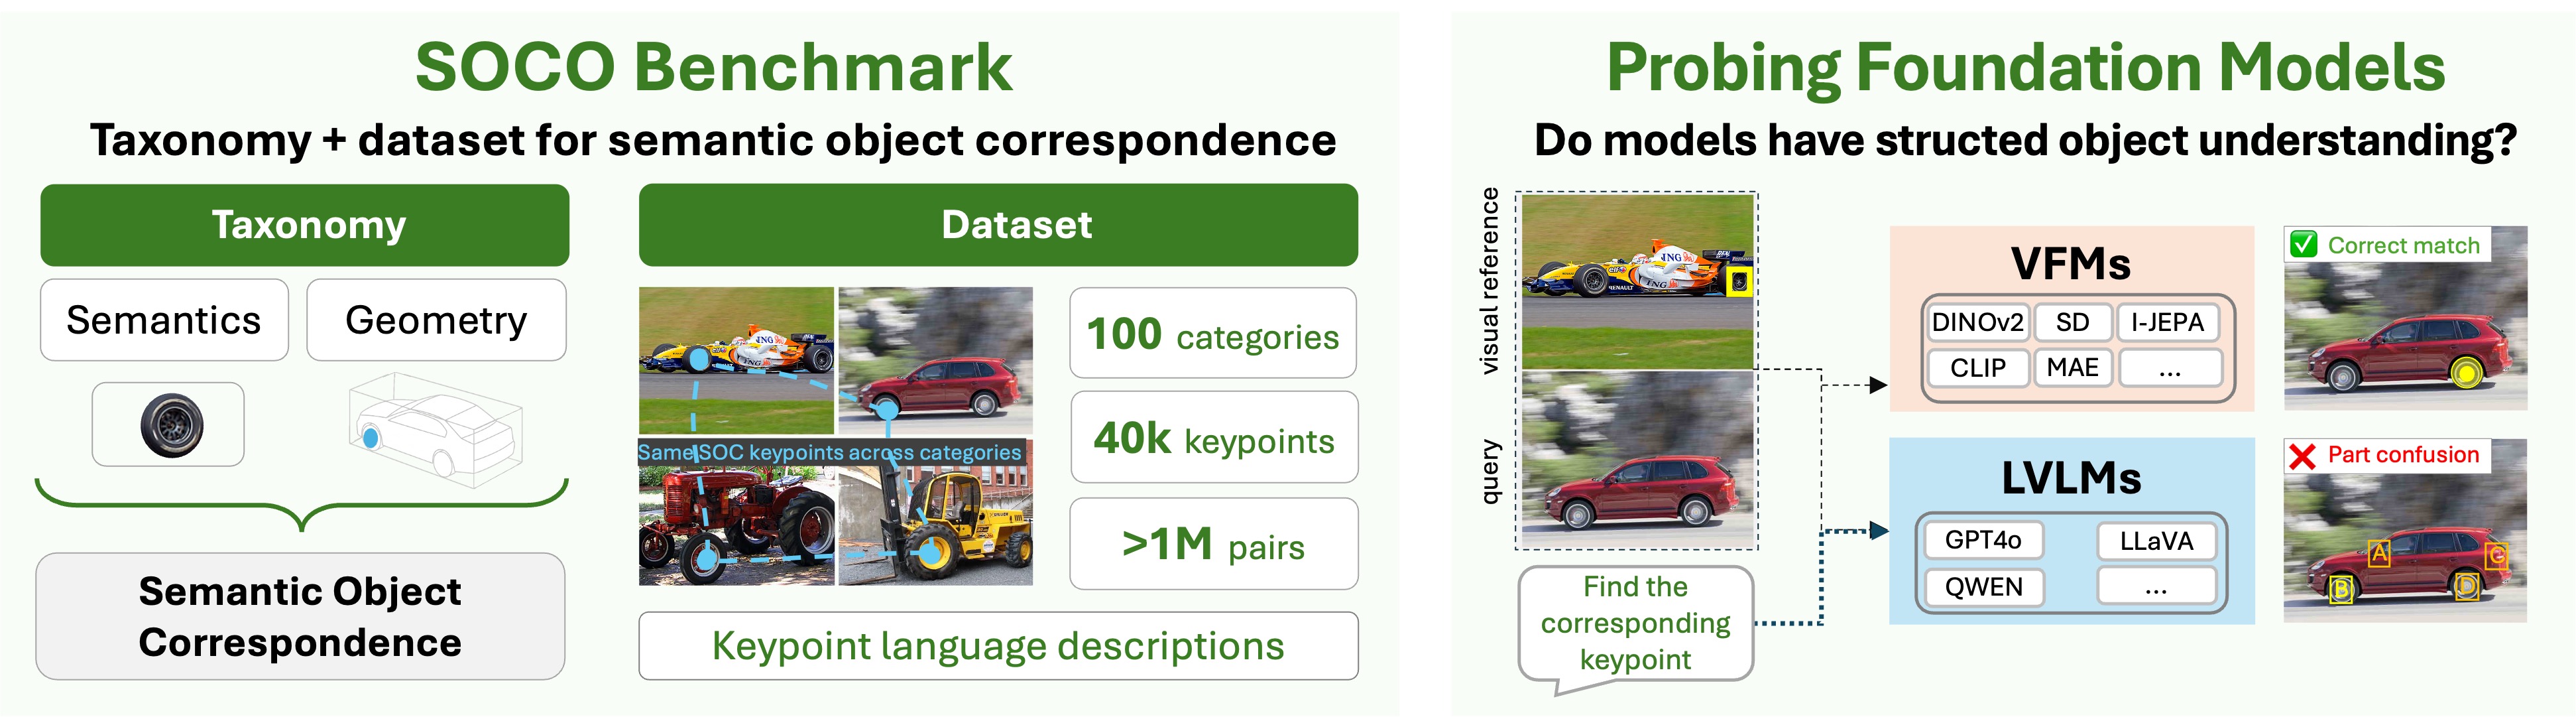
SOCO provides the first taxonomy-driven, language-grounded formulation of
Semantic Object Correspondence, with structured, cross-category part
annotations across 100 diverse categories — enabling evaluation of structured object
understanding in vision foundation models (VFMs) and large vision–language models (LVLMs).
Abstract
Measuring structured object understanding in vision foundation models remains challenging
due to inconsistent evaluation protocols and limited part-level supervision. Semantic
correspondence (SC) evaluates this capability by testing whether object parts can be matched
across instances and categories under large variations in appearance, viewpoint, and
geometry. To enable a systematic SC evaluation, we introduce SOCO, a new
benchmark for Semantic Object Correspondence covering 100 categories
and over 1M correspondence pairs. SOCO introduces a taxonomy of
correspondence types, provides consistent and functionally meaningful keypoint annotations,
and expands both the scale and category diversity of previous datasets. In addition, SOCO
includes keypoint language descriptions, enabling the evaluation of large vision–language
models (LVLMs) and their fine-grained part-level understanding. Comprehensive experiments
reveal that (i) vision foundation backbones encode strong semantic structure but transfer
correspondences poorly across related categories and only partially capture object-part
position, (ii) LVLMs are stronger at text-prompted part localisation than at visual-reference
cross-image matching, and (iii) correspondence performance correlates strongly with
downstream tasks such as segmentation, tracking, 3D pose estimation, and 3D detection.
Together, these findings position SOCO as a benchmark for evaluating structured, part-level
representation quality in modern vision and multimodal foundation models.
Core Concept
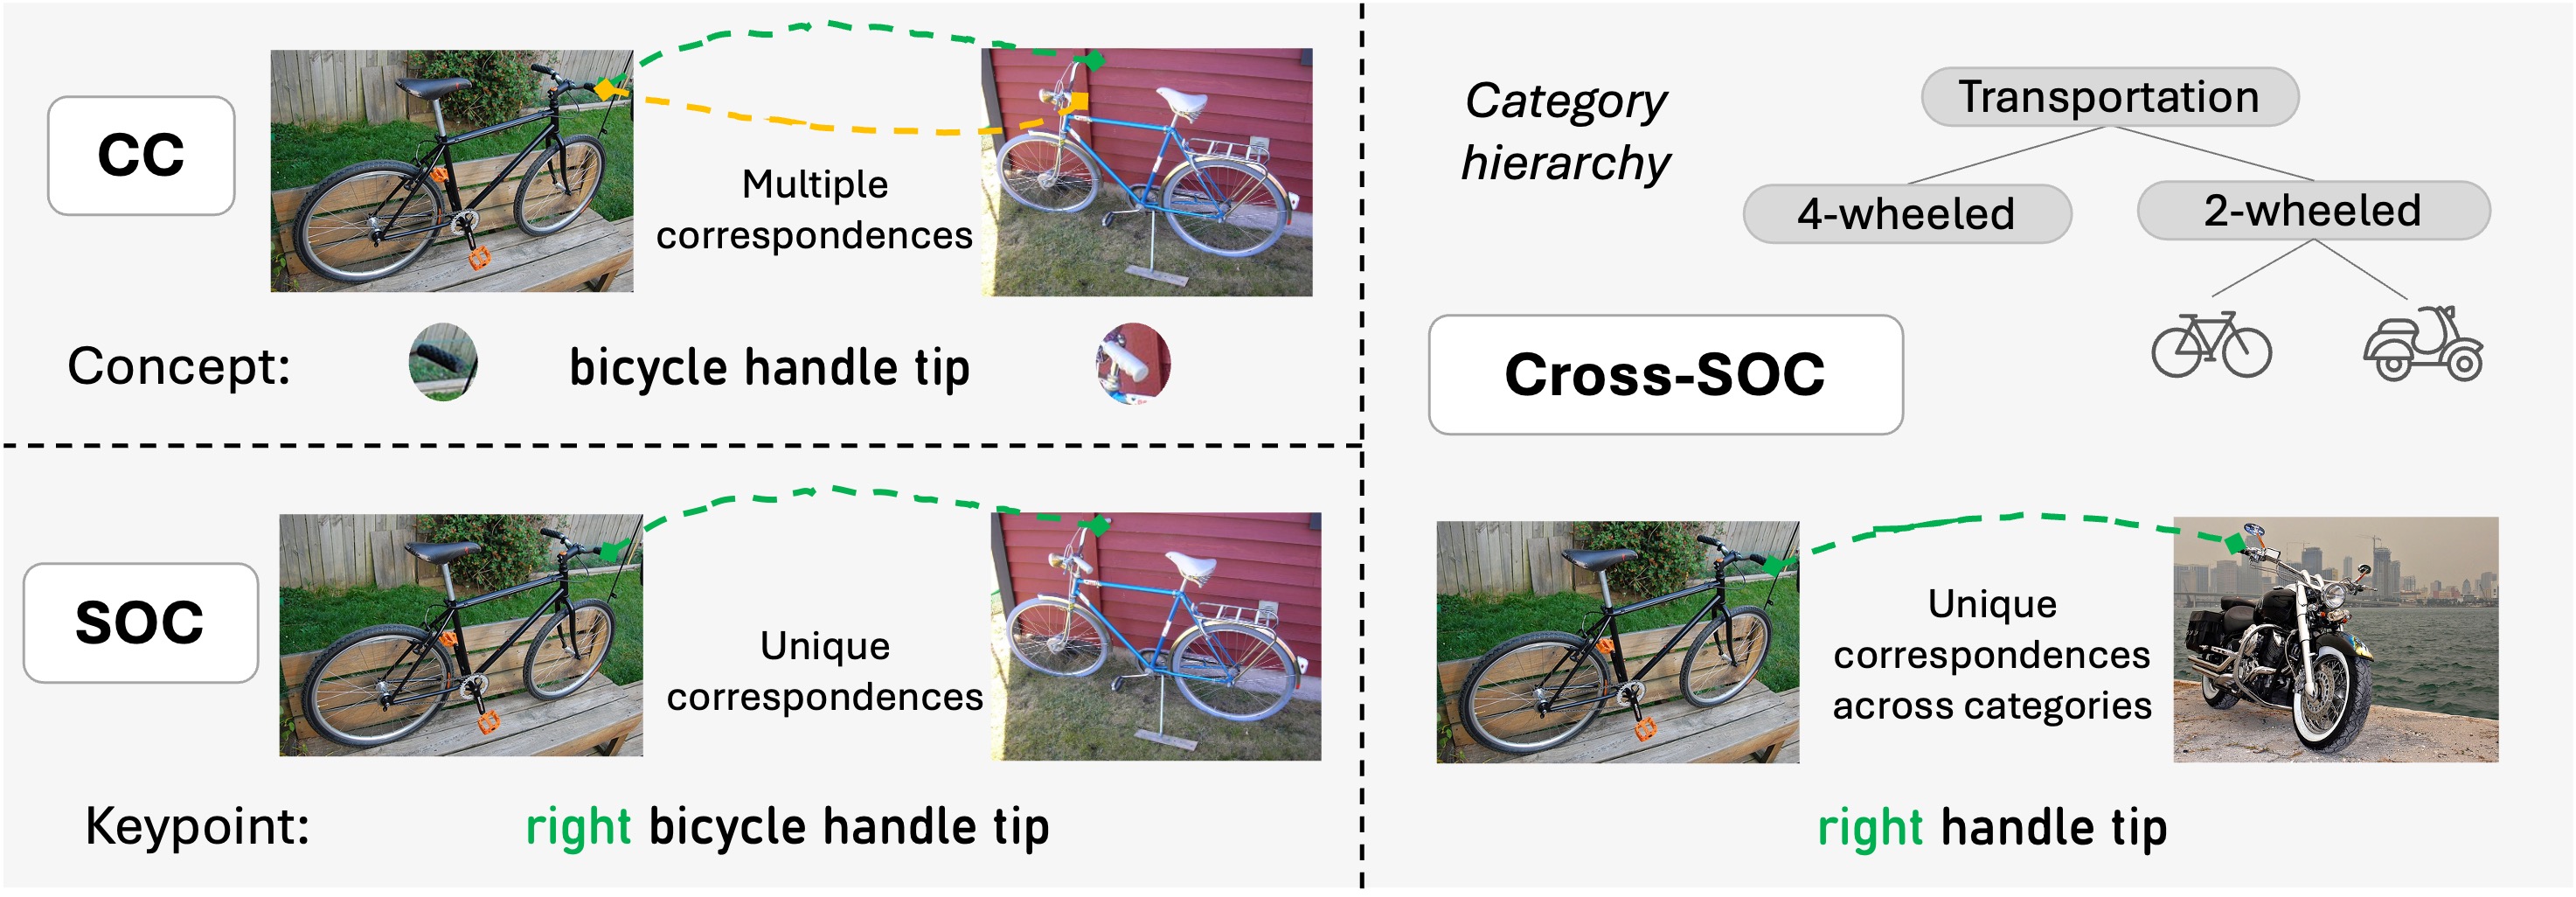
Semantic Object Correspondence (SOC)
A taxonomy-driven formulation of semantic correspondence that disentangles three distinct
abilities collapsed by prior benchmarks: recognising the same local concept
(CC), identifying the correct object-relative instance of that concept
(SOC), and transferring concepts across related categories
(Cross-SOC). This decomposition standardises what counts as a valid
correspondence and makes distinct model failure modes separately measurable.
The SOCO Benchmark
SOCO reframes correspondence evaluation around a taxonomy of object parts.
Every keypoint is tied to a hierarchical, functionally meaningful concept, allowing
consistent part definitions both within and across object categories.
Figure 1. The SOC taxonomy. Marker shape encodes the shared
semantic concept (e.g., a wheel), while colour encodes object-relative identity
(e.g., front-left vs. rear-right). This structure supports matching the same concept within
an object, distinguishing its repeated instances, and aligning concepts across related
categories.
A Taxonomy of Correspondence
SOC decomposes a single correspondence score into three progressively harder tasks, each
isolating a distinct aspect of structured object understanding.
CC
Concept Correspondence
Match the same local semantic concept across instances (e.g., a wheel centre to a
wheel centre) — pure part recognition, ignoring which specific instance it is.
SOC
Semantic Object Correspondence
Match the same concept with the same object-relative identity (front-left
wheel to front-left wheel) — requiring awareness of object geometry and structure.
Cross-SOC
Cross-Category SOC
Match object-relative keypoints across related categories through shared
taxonomy concepts (a wheel on a car, bus, or tractor) — requiring category-level
abstraction.
Dataset at a Glance
SOCO substantially expands the scale, diversity, and consistency of prior correspondence
datasets, and is the first to pair every keypoint with a natural-language description.
100
object categories
4000
images
40k
manually annotated keypoints
>1M
correspondence pairs
✎
per-keypoint language descriptions
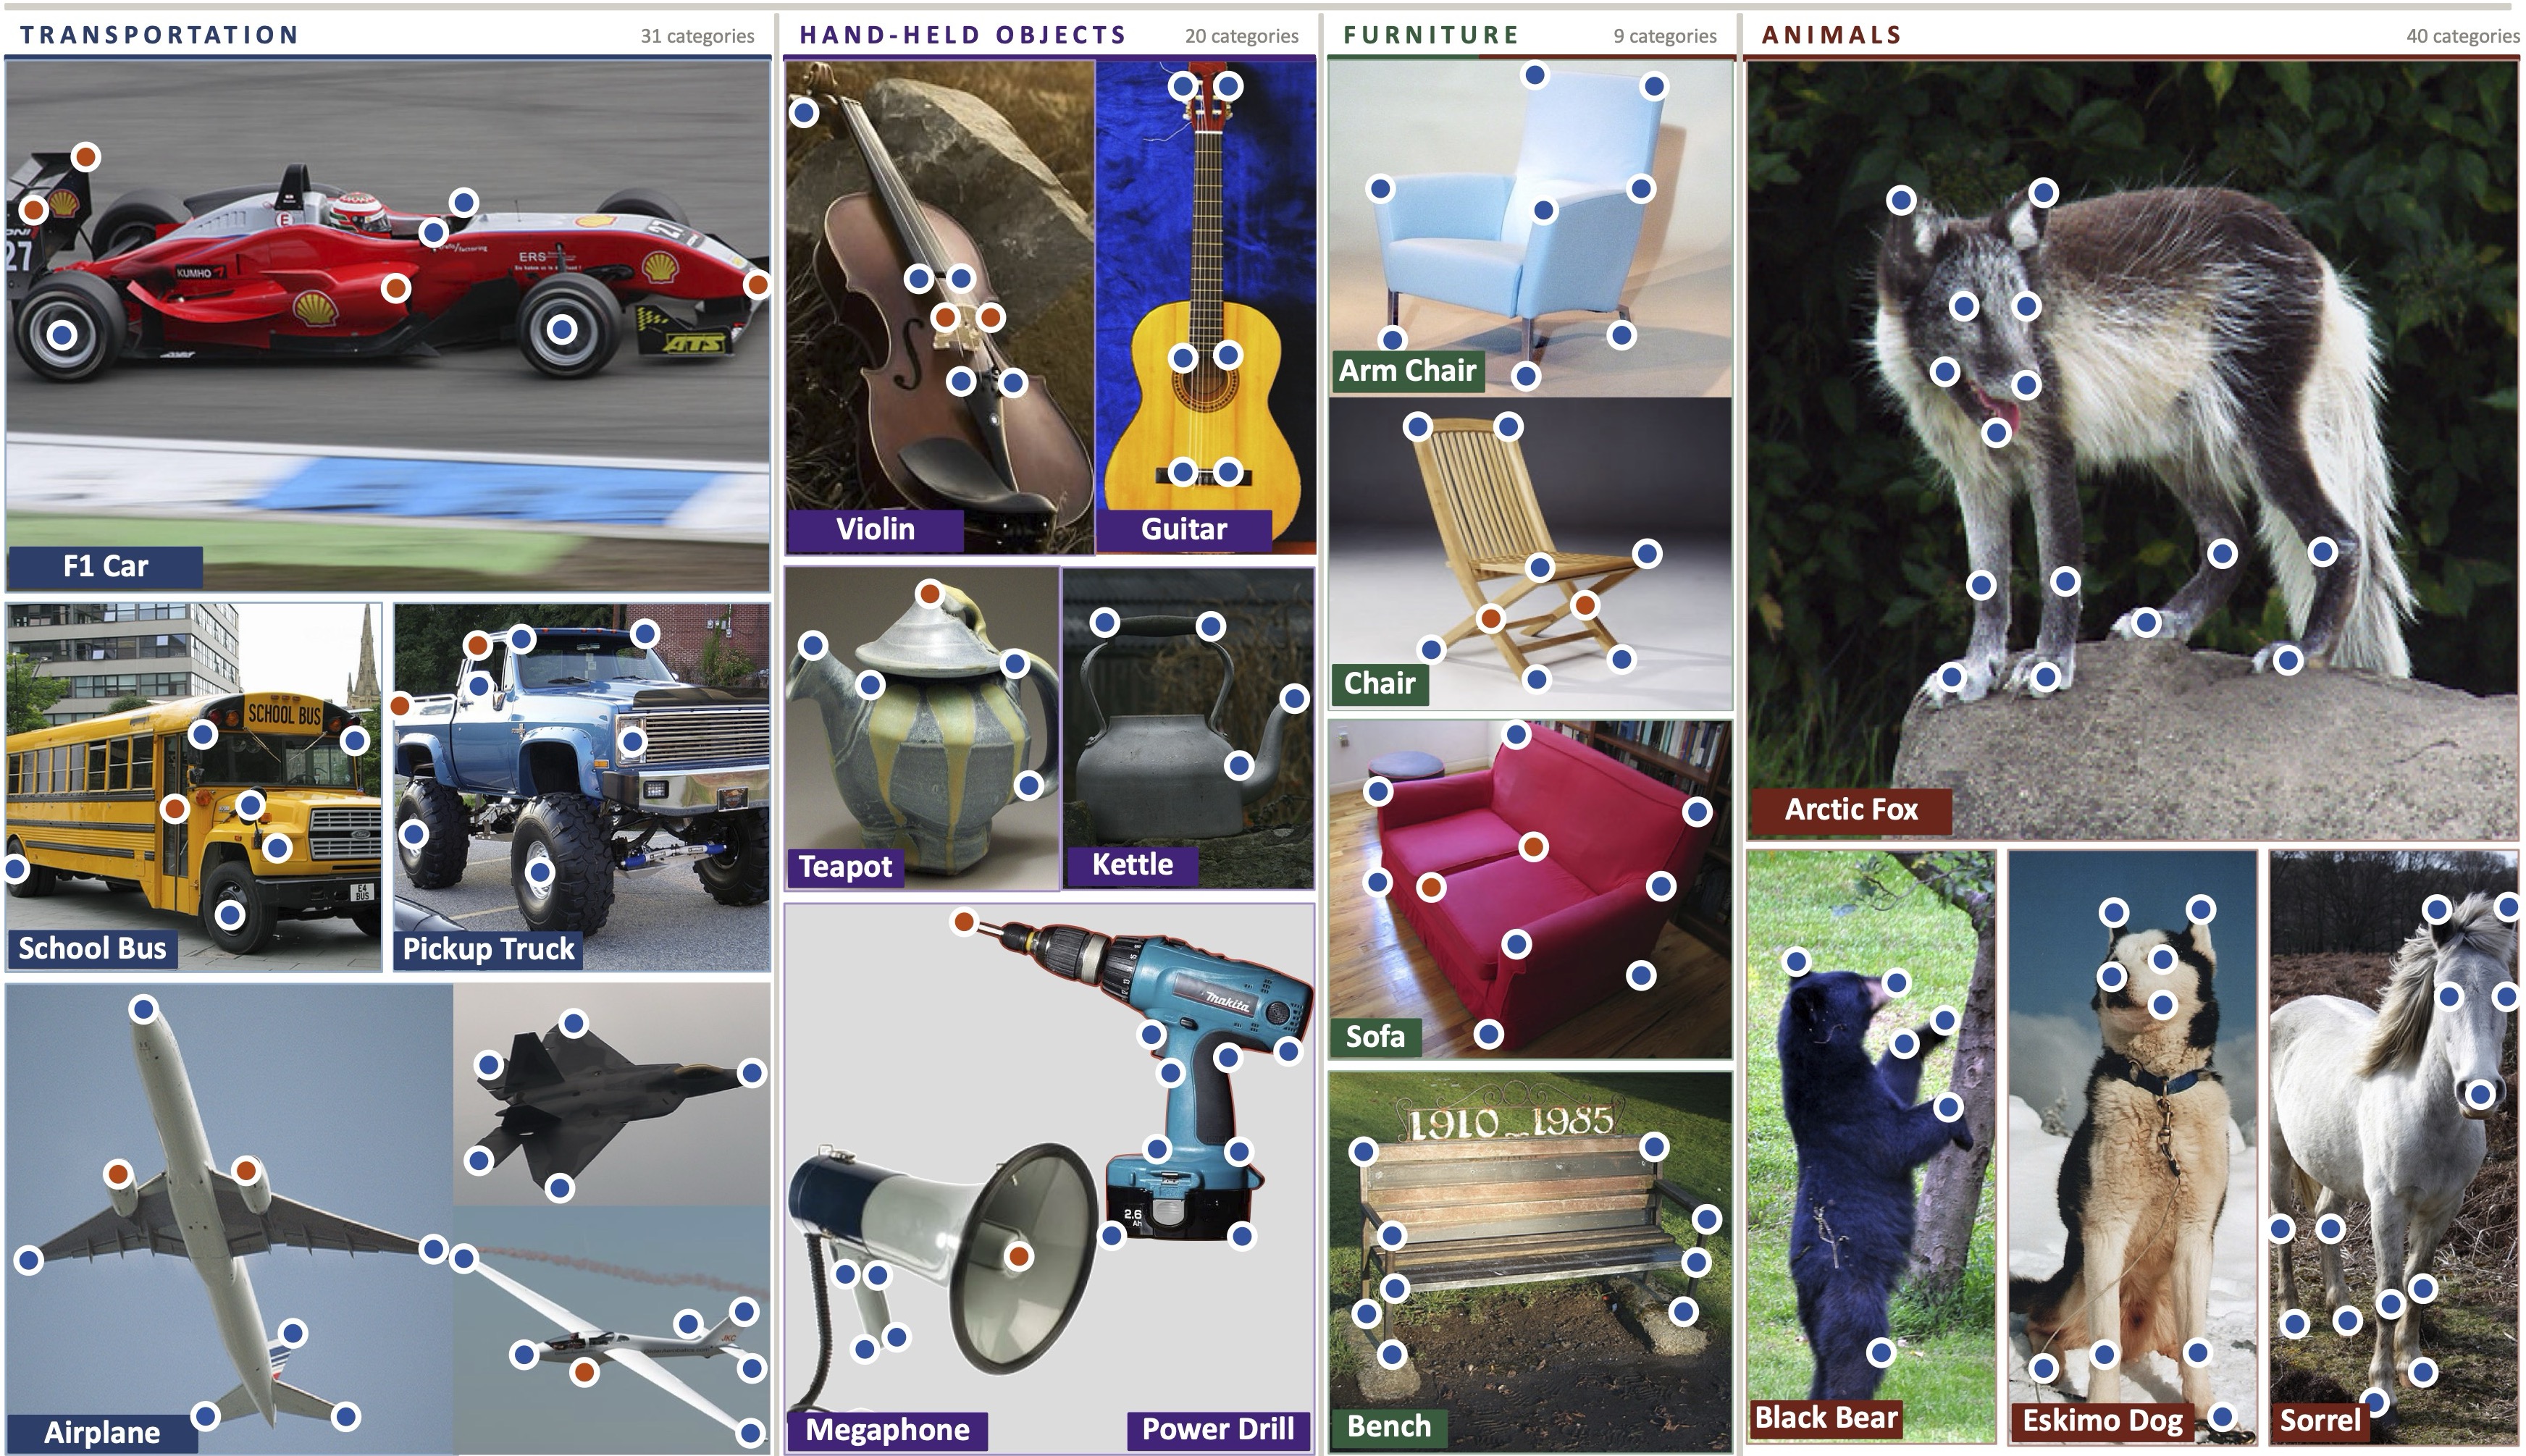
Categories span four super-classes — Transportation,
Hand-held objects, Furniture, and Animals —
sharing a hierarchical vocabulary of semantic concepts that enables consistent intra- and
cross-category matching.
Evaluation & Findings
We evaluate a broad family of vision foundation models and large vision–language models on
the SOC taxonomy, and study how SOC relates to dense downstream tasks across 37 vision models —
all run with OmniProbe, our unified evaluation framework.
01
Concepts are easy; object geometry is hard
Strong backbones recognise local concepts well but degrade sharply when object-relative
identity is required. Even the best model, DINOv2, drops from
78.9 (CC) to 60.4 (SOC) — a consistent
CC→SOC repeated-part confusion across every model.
02
Cross-category transfer remains challenging
Moving from SOC to Cross-SOC reveals limited category-level abstraction:
DINOv2 falls further to 55.0, and most backbones lose 15–24 points from
CC, exposing reliance on category-specific appearance.
03
LVLMs read text better than they match images
Current LVLMs are far stronger at text-prompted part localisation than at
visual-reference cross-image matching. Qwen3-VL-8B rises from
34.2 (Vis.) to 54.0 (Desc.) — yet all remain well below
the DINOv2 ceiling of 81.0.
04
SOC is a better diagnostic than ImageNet kNN
Across 37 vision models, SOC correlates with dense downstream tasks — segmentation,
tracking, 3D pose, 3D detection — far more strongly than ImageNet kNN
classification, making it a practical zero-shot probe of representation quality.
Model Performance on SOCO
PCK@0.1 across the three correspondence tasks. Click a row to toggle that model on or off
in the chart — the lines make the CC→SOC→Cross-SOC drop visible for every model.
Model
CC
SOC
Cross-SOC
Avg
DINOv2
78.9
60.4
55.0
64.8
DINOv3
69.7
55.5
49.4
58.2
C-RADIOv3
69.0
51.1
46.3
55.5
I-JEPA
60.5
46.3
38.4
48.4
DUNE
60.1
45.7
38.5
48.1
PE-Spatial
60.6
43.8
38.8
47.7
SD 2.1
56.0
44.8
38.3
46.4
iBOT
55.2
39.6
34.1
43.0
PIXIO
49.5
37.5
32.9
40.0
DINOv1
43.8
30.6
23.9
32.8
QWEN-L
27.2
19.4
16.2
20.9
CLIP
24.9
16.1
11.2
17.4
CroCov2
15.2
10.2
7.8
11.1
MAE
14.4
9.4
7.2
10.3
PCK@0.1 across the three correspondence tasks. Performance drops monotonically from CC to
SOC to Cross-SOC for every model.
SOC by Super-category
SOC accuracy broken down by SOCO's four super-categories. Models behave quite differently
across object families: e.g. DINOv3 leads on furniture, while
DINOv2 dominates transportation, hand-held objects, and animals.
Click a row to toggle that model on or off in the radar chart.
Model
Transp.
Hand
Furn.
Animals
DINOv2
56.9
61.6
45.5
66.3
DINOv3
51.6
57.4
59.9
56.6
C-RADIOv3
51.7
48.1
39.7
54.8
I-JEPA
41.5
51.0
46.7
47.7
DUNE
40.0
50.5
51.0
46.6
PE-Spatial
45.1
40.7
37.6
45.9
SD 2.1
42.4
45.3
47.7
45.6
iBOT
36.1
40.1
32.8
43.9
PIXIO
37.3
40.2
46.7
34.2
DINOv1
29.1
32.9
27.4
31.4
QWEN-L
21.7
24.1
22.6
14.5
CLIP
17.5
14.2
11.6
16.9
CroCov2
11.6
12.3
10.2
8.1
MAE
10.0
11.9
11.7
7.1
SOC accuracy across the four SOCO super-categories. Higher is better on every axis.
Isolating Geometric Awareness (SOC-geo)
SOC-geo restricts the candidates to keypoints of the same semantic concept, so the
model only has to identify the correct geometric position (e.g. front-left vs. rear-right
wheel). Random baseline ≈ 41.2 %. The ranking changes substantially:
SD 2.1 leads, and DINOv3 surpasses DINOv2
— geometric part awareness does not track overall SOC.
Figure 2. SOC vs SOC-geo per model, sorted by SOC-geo descending. Each
series uses its own y-axis: SOC starts at 0, SOC-geo starts at its random baseline
(41.2 %), so each bar's height already represents the signal above chance.
SOC as a Representation Diagnostic
Across 37 vision models, we compare how well SOC and
ImageNet kNN predict performance on dense downstream tasks (Pearson r).
SOC dominates kNN on every task.
Figure 3. Per-task Pearson r across 37 vision models. Higher is
better; SOC correlates more strongly than ImageNet kNN with every downstream task.
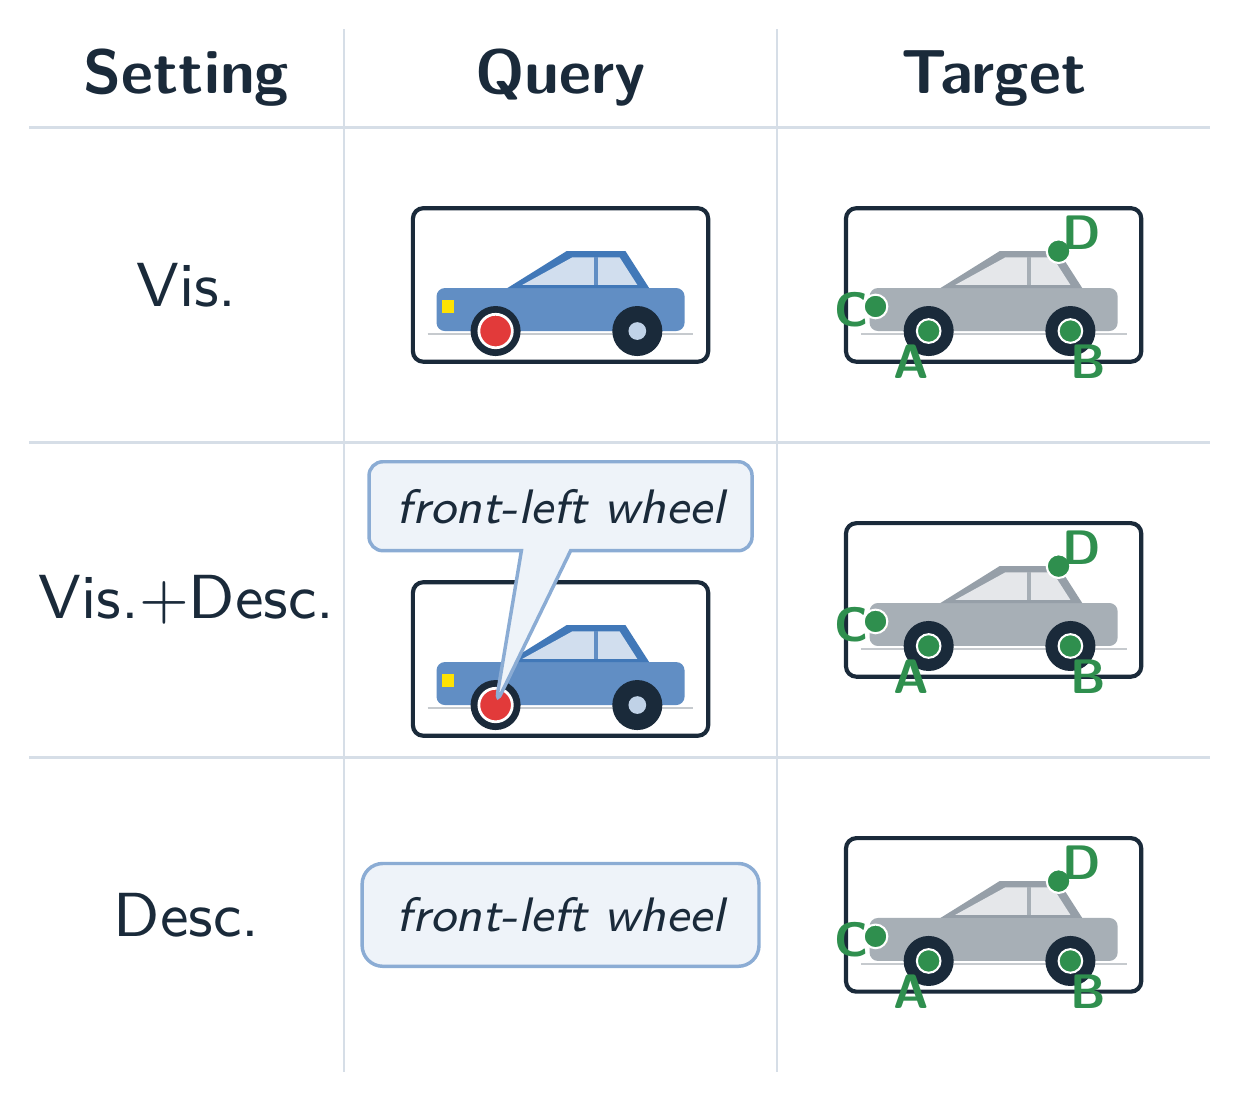
Large Vision–Language Models
All settings show the target image with candidate keypoints; only the query differs.
Vis. marks the query in a source image, Vis.+Desc. adds the keypoint
description, and Desc. uses the description alone. LVLMs improve markedly as language
is added, but remain well below the strongest vision backbones (cf. table above).
Method
Vis.
Vis.+Desc.
Desc.
Random
0.4
0.4
0.4
Random++
25.0
25.0
25.0
DINOv2 (VFM ceiling)
81.0
—
—
LLaVA-OV-7B
2.9
14.1
24.3
InternVL3.5-8B
24.9
38.5
39.6
Qwen2.5-VL-3B
5.2
17.4
29.9
Qwen2.5-VL-7B
19.4
30.8
39.1
Qwen3-VL-4B
8.6
18.0
44.4
Qwen3-VL-8B
34.2
30.8
54.0
GPT4o
30.2
30.9
37.6
The three LVLM evaluation settings.
Example Annotations
Taxonomy-driven keypoint annotations across diverse categories, with consistent semantic
concepts and object-relative identities.
Figure 4. Example SOCO annotations. Marker shape encodes the shared
semantic concept and colour encodes object-relative identity, kept consistent within and
across related categories.
OmniProbe
A unified framework for evaluating visual features across dense tasks. Result for the 37-model correlation study were
produced with OmniProbe, and the same single command lets you reproduce them or probe your own model on SOCO or on other tasks.
7
dense task families
92
backbone configurations
25+
model families
1
unified CLI & Python API
One consistent interface spans seven task families:
correspondence (SPair, SOCO, NAVI, ScanNet, AP-10K),
depth, surface normals,
segmentation (ADE20K), 3D pose,
tracking (TAP-Vid), and classification (ImageNet) —
across 92 pre-configured backbones (DINOv2/DINOv3, CLIP, SAM, MAE, diffusion models, and more),
all driven by a Hydra configuration system.
# install
uv sync --extra all

# probe DINOv2 on SOCO (nearest-neighbour correspondence)
python -m omniprobe.run task=correspondence_soco backbone=dinov2_b14 task.mode=nn

# ...or from Python
import omniprobe
omniprobe.evaluate(task="correspondence_soco", backbone="dinov2_b14", mode="nn")
Acknowledgments
AK acknowledges support via his Emmy Noether Research Group funded by the German Research
Foundation (DFG) under grant number 468670075.
We thank Matthis Heimberg for early analyses and experiments.
BibTeX
@article{duenkel2026soco,
  title   = {SOCO: Benchmarking Semantic Object Correspondence in Vision Foundation Models},
  author  = {D{\"u}nkel, Olaf and Sunagad, Basavaraj and Wang, Haoran and
             Hoffmann, David T. and Theobalt, Christian and Kortylewski, Adam},
  journal = {arXiv preprint arXiv:2605.31597},
  year    = {2026}
}